Thursday, March 5, 2015
SAT Comparisons 1990 vs 2004 (Team F)
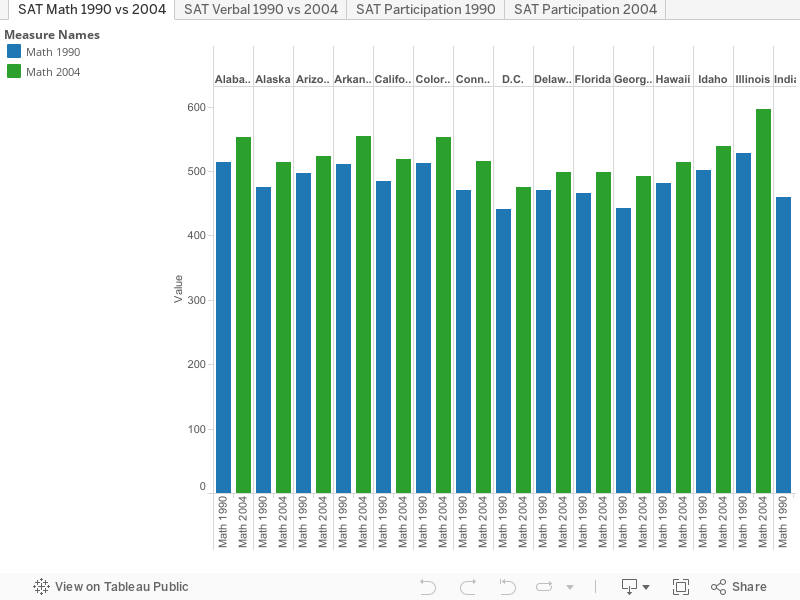
The SAT was first introduced in 1926 and since then it has been a way for Universities all around the United States to measure potential students intellect. Since 1926 the basic way of taking the SAT, the participation of it, and the average scores for its various parts have all changed over time. The graphs below show a couple of different things. First, the geographical graphs shows the participation rate of the SAT in 2004 and in 1990. Secondly the other graphs compare average scores on the Math portion and the verbal portion of the exam taken in 1990 to the portion in 2004.
Subscribe to:
Post Comments (Atom)
No comments:
Post a Comment