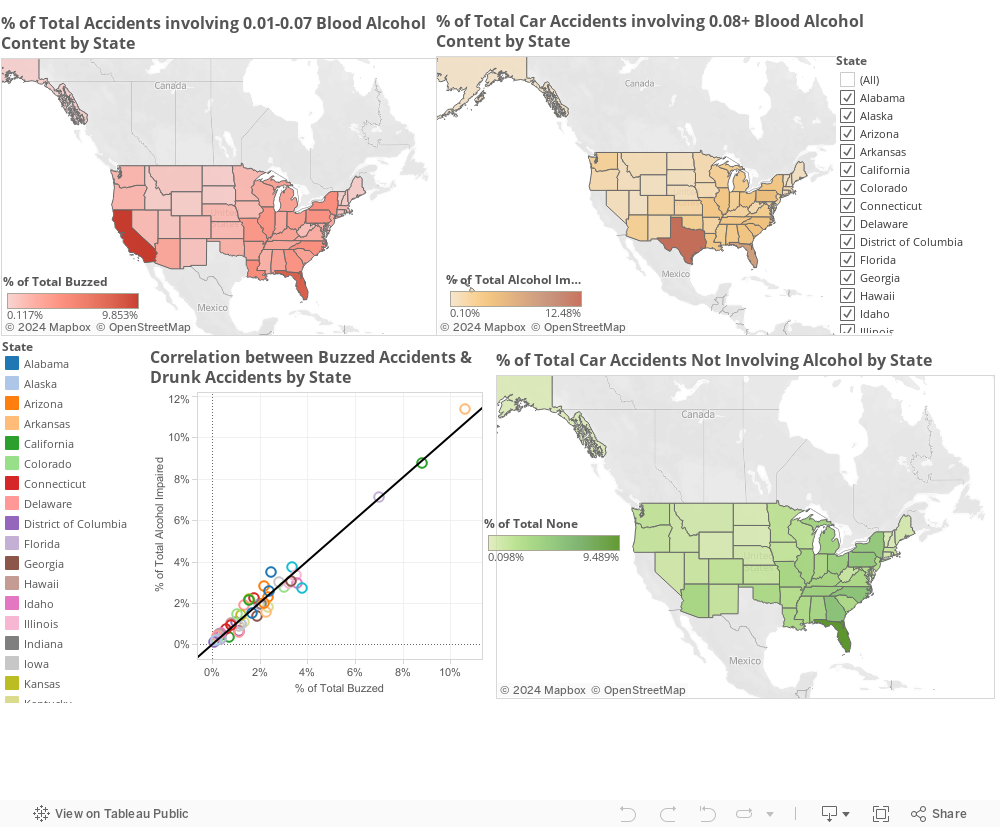
The data contains traffic accidents for each state categorized by Blood Alcohol Content (BAC) into three groups: 0.00 BAC (Sober), 0.01 - 0.07 BAC (Buzzed), 0.08 or more BAC (Drunk). The visualizations show each category on the map where the darker color represents the higher percentage of total accidents and there is a scatterplot to show the positive correlation between %
of buzzed accidents and % of drunk accidents for each state.
No comments:
Post a Comment